The short answer
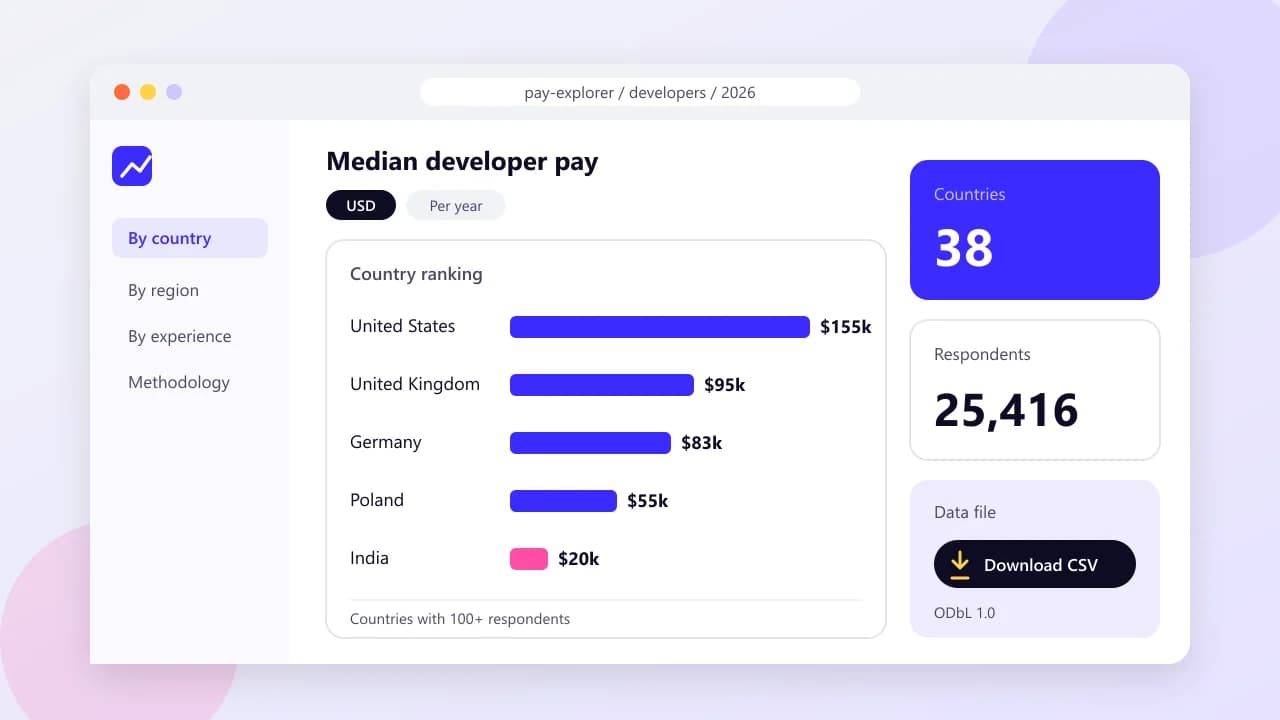
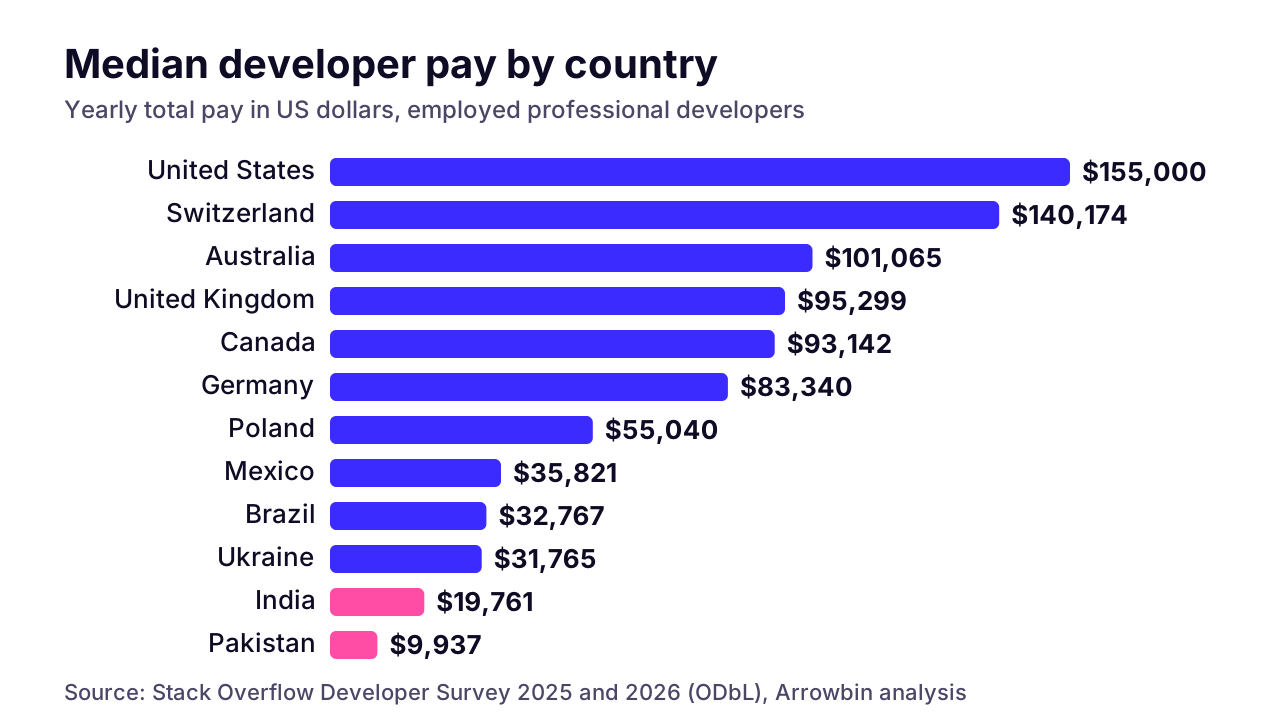
Across the 38 countries with at least 100 respondents in Stack Overflow's 2025 and 2026 developer surveys, the median employed developer earns $155,000 a year in the United States, $95,299 in the UK, $83,340 in Germany, $55,040 in Poland, $19,761 in India and $9,937 in Pakistan. That puts the US median at 7.8 times India's and 15.6 times Pakistan's. The gap narrows with experience: Indian developers with 10+ years earn about a quarter of their US peers, against about a tenth for those with under five years. Bangladesh had 92 qualifying respondents, under our threshold, so we don't publish a figure for it.
On this page
Most pages that list developer salaries by country don't say where the numbers come from. Some pull from salary sites with unknown samples. Some just repeat each other. We wanted figures we could defend, so we computed them from Stack Overflow's public survey files and published our working.
This is for founders comparing teams in different countries, and for anyone who needs a pay figure they can cite. Arrowbin builds software for clients worldwide with engineers in a lower-cost country, so we have a stake in getting these numbers right, including the places where the data runs thin.
You can download the CSV with every number in this post. You'll find the method, its limits and a suggested citation near the end.
How much do software developers earn by country in 2026?
In Stack Overflow's 2025 and 2026 developer surveys, the median employed developer earns $155,000 a year in the United States, $95,299 in the United Kingdom, $83,340 in Germany, $55,040 in Poland, $19,761 in India and $9,937 in Pakistan. Those are medians of total yearly pay in US dollars, from 25,416 developers across both survey waves.
Median means the middle person: half earn more, half earn less. It's a better guide than an average, which a few very high earners can drag upward. Pay here means the survey's own question about total yearly compensation (salary, bonuses and perks, before tax), converted to dollars by Stack Overflow.
 (opens the full-size chart in a new tab)
Most people want the ratio. In this data, the US median is 7.8 times India's and 15.6 times Pakistan's. Germany's is 4.2 times India's, and Poland's is 2.8 times.
Where samples are large, the two survey waves agree closely. In the US, the median is $155,000 in both years. India's is $19,761 in the 2025 wave and $19,586 in 2026, and Germany's moves from $83,531 to $81,884. That steadiness is why we were comfortable pooling them.
Which countries pay software developers the most and the least?
Among the 38 countries with at least 100 qualifying respondents, the United States pays the most ($155,000), followed by Israel ($147,071) and Switzerland ($140,174). Pakistan ($9,937) and India ($19,761) pay the least, with Turkey ($30,297) next. Here's the full table, sorted by median.
United States
- Respondents (n)
- 6,098
- Median pay (USD a year)
- $155,000
- Middle 50% (USD)
- $115,000–$200,000
Israel
- Respondents (n)
- 209
- Median pay (USD a year)
- $147,071
- Middle 50% (USD)
- $105,891–$185,310
Switzerland
- Respondents (n)
- 490
- Median pay (USD a year)
- $140,174
- Middle 50% (USD)
- $112,288–$164,914
Ireland
- Respondents (n)
- 168
- Median pay (USD a year)
- $113,728
- Middle 50% (USD)
- $87,881–$139,218
Denmark
- Respondents (n)
- 274
- Median pay (USD a year)
- $101,088
- Middle 50% (USD)
- $82,582–$124,416
Australia
- Respondents (n)
- 620
- Median pay (USD a year)
- $101,065
- Middle 50% (USD)
- $83,058–$125,460
United Kingdom
- Respondents (n)
- 1,757
- Median pay (USD a year)
- $95,299
- Middle 50% (USD)
- $68,071–$126,347
Norway
- Respondents (n)
- 238
- Median pay (USD a year)
- $93,886
- Middle 50% (USD)
- $78,766–$116,097
Canada
- Respondents (n)
- 1,054
- Median pay (USD a year)
- $93,142
- Middle 50% (USD)
- $70,914–$127,645
Germany
- Respondents (n)
- 2,472
- Median pay (USD a year)
- $83,340
- Middle 50% (USD)
- $64,968–$103,833
Netherlands
- Respondents (n)
- 725
- Median pay (USD a year)
- $81,210
- Middle 50% (USD)
- $60,276–$102,355
New Zealand
- Respondents (n)
- 192
- Median pay (USD a year)
- $81,088
- Middle 50% (USD)
- $60,643–$102,400
Austria
- Respondents (n)
- 318
- Median pay (USD a year)
- $79,598
- Middle 50% (USD)
- $58,007–$98,612
Finland
- Respondents (n)
- 211
- Median pay (USD a year)
- $76,570
- Middle 50% (USD)
- $58,007–$92,812
Sweden
- Respondents (n)
- 537
- Median pay (USD a year)
- $71,698
- Middle 50% (USD)
- $58,700–$84,277
Belgium
- Respondents (n)
- 220
- Median pay (USD a year)
- $68,237
- Middle 50% (USD)
- $53,251–$87,011
Spain
- Respondents (n)
- 621
- Median pay (USD a year)
- $62,648
- Middle 50% (USD)
- $45,246–$85,296
France
- Respondents (n)
- 1,077
- Median pay (USD a year)
- $61,488
- Middle 50% (USD)
- $48,726–$81,210
Portugal
- Respondents (n)
- 262
- Median pay (USD a year)
- $58,007
- Middle 50% (USD)
- $40,605–$79,903
Japan
- Respondents (n)
- 150
- Median pay (USD a year)
- $56,825
- Middle 50% (USD)
- $35,533–$79,571
Czech Republic
- Respondents (n)
- 293
- Median pay (USD a year)
- $56,438
- Middle 50% (USD)
- $37,530–$78,633
Poland
- Respondents (n)
- 534
- Median pay (USD a year)
- $55,040
- Middle 50% (USD)
- $33,512–$81,870
Bulgaria
- Respondents (n)
- 175
- Median pay (USD a year)
- $52,315
- Middle 50% (USD)
- $34,873–$71,977
Romania
- Respondents (n)
- 179
- Median pay (USD a year)
- $52,170
- Middle 50% (USD)
- $25,913–$75,525
South Africa
- Respondents (n)
- 178
- Median pay (USD a year)
- $49,292
- Middle 50% (USD)
- $24,033–$71,697
Hungary
- Respondents (n)
- 172
- Median pay (USD a year)
- $49,009
- Middle 50% (USD)
- $31,122–$74,616
Italy
- Respondents (n)
- 597
- Median pay (USD a year)
- $46,406
- Middle 50% (USD)
- $36,393–$62,550
Greece
- Respondents (n)
- 177
- Median pay (USD a year)
- $44,666
- Middle 50% (USD)
- $31,844–$69,609
China
- Respondents (n)
- 106
- Median pay (USD a year)
- $41,786
- Middle 50% (USD)
- $23,560–$72,834
Argentina
- Respondents (n)
- 118
- Median pay (USD a year)
- $41,347
- Middle 50% (USD)
- $27,007–$71,243
Colombia
- Respondents (n)
- 103
- Median pay (USD a year)
- $40,487
- Middle 50% (USD)
- $18,975–$60,000
Russia
- Respondents (n)
- 150
- Median pay (USD a year)
- $38,278
- Middle 50% (USD)
- $15,311–$60,000
Mexico
- Respondents (n)
- 180
- Median pay (USD a year)
- $35,821
- Middle 50% (USD)
- $18,519–$58,193
Brazil
- Respondents (n)
- 594
- Median pay (USD a year)
- $32,767
- Middle 50% (USD)
- $16,383–$54,574
Ukraine
- Respondents (n)
- 611
- Median pay (USD a year)
- $31,765
- Middle 50% (USD)
- $8,896–$55,409
Turkey
- Respondents (n)
- 171
- Median pay (USD a year)
- $30,297
- Middle 50% (USD)
- $13,969–$53,021
India
- Respondents (n)
- 1,149
- Median pay (USD a year)
- $19,761
- Middle 50% (USD)
- $8,879–$39,521
Pakistan
- Respondents (n)
- 107
- Median pay (USD a year)
- $9,937
- Middle 50% (USD)
- $4,636–$17,780
Each middle 50% range runs from the 25th to the 75th percentile, so it shows how spread out pay is inside each country. Read it before you read the median. India's middle half runs from $8,879 to $39,521, about a 4.5x spread, which is wider than the gap between the Polish and German medians.
Our view: treat countries with fewer than about 200 respondents as rough. Small samples move around between years. Ukraine's median was $29,958 in the 2025 wave and $39,800 in 2026.
How big is the developer pay gap between regions?
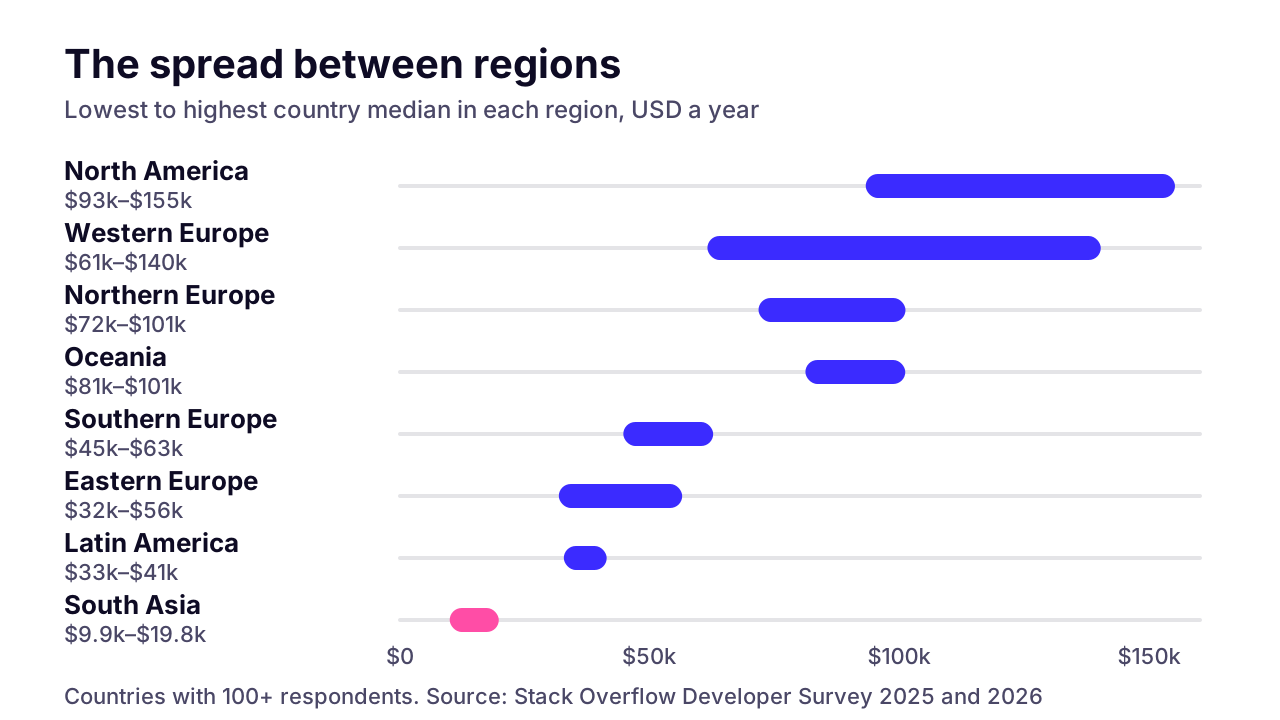
Country medians run from $93,142 to $155,000 in North America, $61,488 to $140,174 in Western Europe, $31,765 to $56,438 in Eastern Europe, $32,767 to $41,347 in Latin America and $9,937 to $19,761 in South Asia. From the lowest country to the highest, the spread is 15.6 times.
 (opens the full-size chart in a new tab)
Eastern Europe and Latin America overlap almost completely. Brazil ($32,767) sits next to Ukraine ($31,765), and Poland ($55,040) is above every Latin American country in the data. If you're choosing between those two regions, time-zone overlap and the specific team matter more than the regional pay level.
Western Europe isn't one market either. Switzerland's median is more than double France's ($140,174 against $61,488). South Asia is the only region where every reported country sits under $20,000.
Regions are our own grouping of the countries that passed the threshold. Use the CSV's region column if you'd rather group them differently.
How much does experience change developer pay in each country?
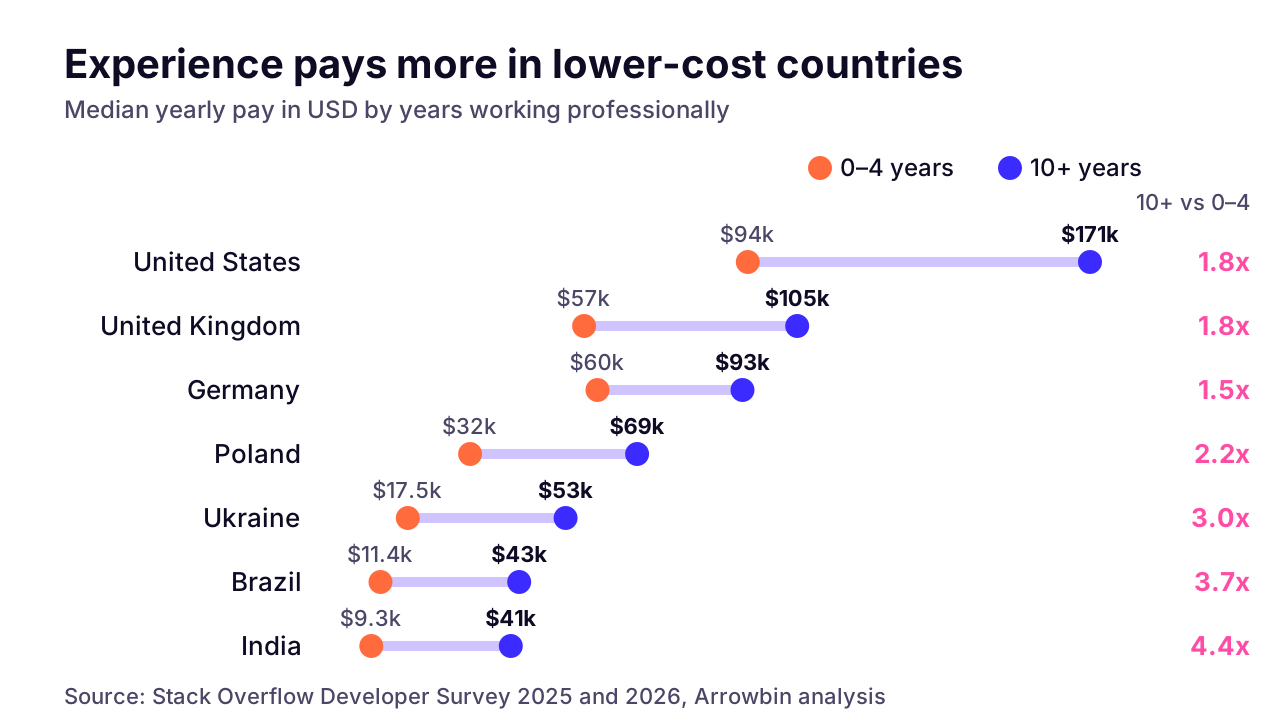
Experience raises pay everywhere, but far more steeply in lower-cost countries. In India, developers with 10 or more years of professional experience earn a median of $40,684, 4.4 times the $9,299 earned by those with up to four years. In the United States the step is 1.8 times, from $94,000 to $171,000.
 (opens the full-size chart in a new tab)
United States
- 0–4 years
- $94,000 (711)
- 5–9 years
- $135,000 (1,225)
- 10+ years
- $171,000 (4,133)
United Kingdom
- 0–4 years
- $57,179 (219)
- 5–9 years
- $81,685 (338)
- 10+ years
- $105,119 (1,194)
Germany
- 0–4 years
- $60,184 (390)
- 5–9 years
- $75,410 (622)
- 10+ years
- $92,812 (1,451)
Poland
- 0–4 years
- $31,520 (127)
- 5–9 years
- $60,257 (148)
- 10+ years
- $69,093 (254)
Ukraine
- 0–4 years
- $17,501 (201)
- 5–9 years
- $40,263 (207)
- 10+ years
- $53,000 (199)
Brazil
- 0–4 years
- $11,367 (112)
- 5–9 years
- $35,169 (137)
- 10+ years
- $42,573 (340)
India
- 0–4 years
- $9,299 (449)
- 5–9 years
- $23,248 (315)
- 10+ years
- $40,684 (356)
Respondent counts are in brackets. We show a band only when it has at least 50 respondents. That's why Pakistan, which passes the country threshold, has no bands: none of its three groups reaches 50.
This changes the offshore maths. For early-career developers, the US median is 10.1 times India's. For developers with 10+ years, it's 4.2 times. Brazil follows the same pattern (8.3 times, falling to 4.0), and so does Ukraine (5.4 times, falling to 3.2).
If you're hiring a small team to build something real, you want the experienced end of that table. You'll still save money there, just much less than headline ratios suggest. A quote that prices senior people at junior rates deserves a closer look.
Why is there no salary figure for Bangladesh, Vietnam or Nigeria?
Too few developers from those countries answered. After filtering, Bangladesh has 92 qualifying respondents across both waves, under our threshold of 100, so we don't publish a median for it. Seven other countries we wanted to cover fall short as well.
Bangladesh
- Qualifying respondents
- 92
- Region
- South Asia
Indonesia
- Qualifying respondents
- 61
- Region
- Southeast Asia
Nigeria
- Qualifying respondents
- 60
- Region
- Africa
Philippines
- Qualifying respondents
- 60
- Region
- Southeast Asia
Egypt
- Qualifying respondents
- 55
- Region
- Africa
Sri Lanka
- Qualifying respondents
- 46
- Region
- South Asia
Vietnam
- Qualifying respondents
- 35
- Region
- Southeast Asia
Nepal
- Qualifying respondents
- 28
- Region
- South Asia
Bangladesh matters to us, and we were tempted to lower the bar. We didn't. A median from 92 people, most of them with under ten years of experience, would look precise and mean little.
Be wary of any page that quotes an exact developer salary for these countries without saying how many people it's based on. Until the samples grow, ask vendors there for their salary bands by level. Their answer tells you a lot about who will be writing your code. For what Bangladeshi teams charge clients, we collected the published figures in app development rates in Bangladesh.
Pooling the two survey waves is what got Pakistan over the line, with 107 respondents. When Stack Overflow publishes its next survey, we'll add that wave and check these countries again.
Do survey salaries match official government pay statistics?
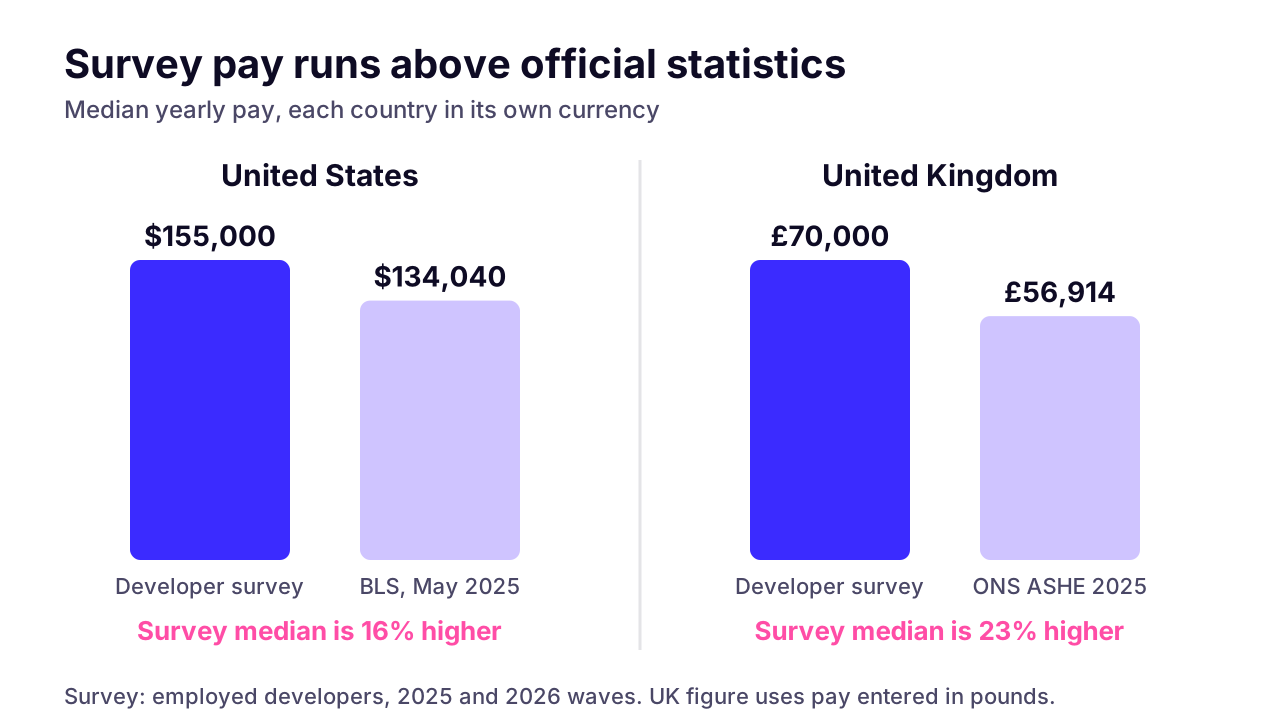
No, they run higher. In the US, the survey median of $155,000 is 16% above the Bureau of Labor Statistics median of $134,040 for software developers, quality assurance analysts and testers (May 2025). In the UK, respondents who entered pay in pounds report a median of £70,000, 23% above the £56,914 that the ONS gives for full-time programmers and software development professionals.
That UK figure is from the ONS Annual Survey of Hours and Earnings, 2025 provisional results, table 14.7a, occupation code 2134. We used the pound figures for the UK so no exchange rate gets in the way of the comparison.
 (opens the full-size chart in a new tab)
Several things drive the gap, and none of them make the survey useless:
- Who answers. Stack Overflow's survey reaches people engaged enough to fill in a long developer questionnaire, and they skew experienced: 4,133 of the 6,098 US respondents (68%) have 10 or more years of professional experience.
- What counts as pay. Respondents report total compensation, bonuses and perks included. BLS publishes a wage estimate built from a survey of employers, and ASHE comes from payroll records.
- Who's in the occupation. Official figures cover every employee in the occupation code, across all sectors and regions. A survey only covers the people who chose to answer it.
So read the survey medians for high-income countries as running somewhat above what a typical employer pays. Rankings and ratios are probably sturdier than the absolute levels, since the same survey method runs in every country, though we can't prove the bias is the same size everywhere. We haven't checked lower-income countries against official occupational data, so we can't say which way their numbers lean.
How does a developer's salary turn into an hourly rate for a client?
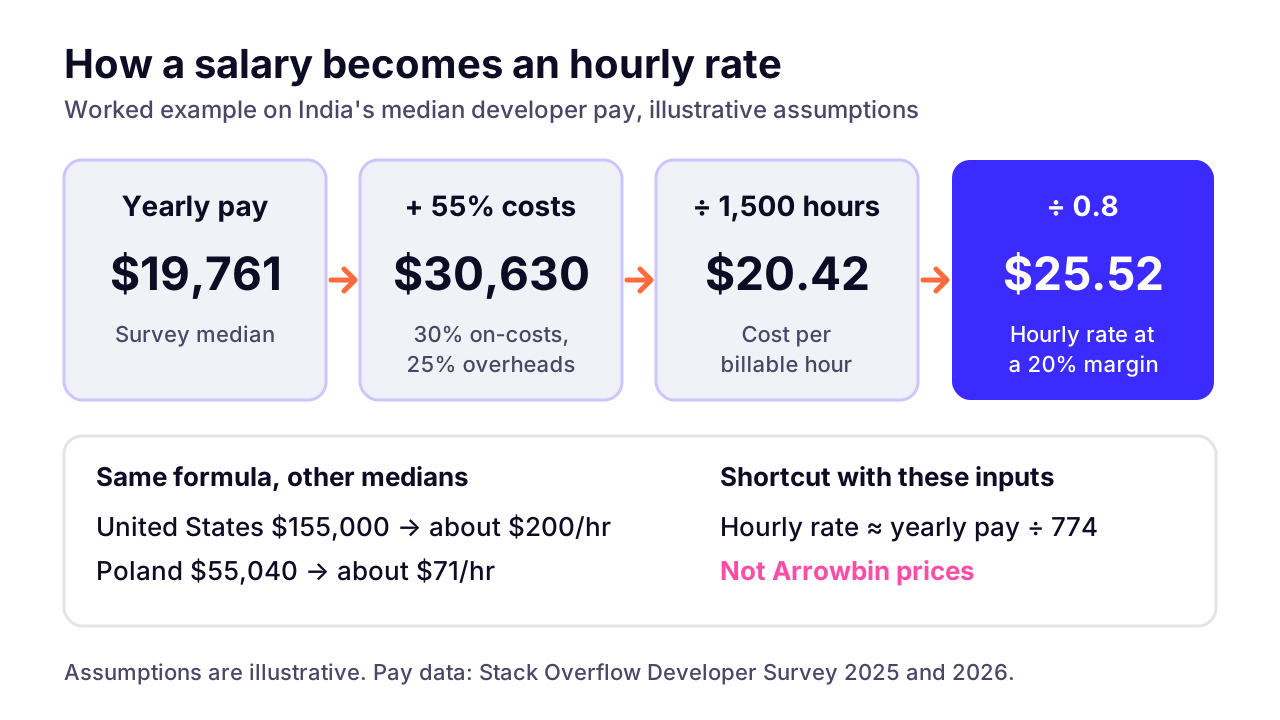
Hourly rate = yearly pay × (1 + on-costs + overheads) ÷ billable hours ÷ (1 − margin). With illustrative inputs of 30% on-costs, 25% overheads, 1,500 billable hours and a 20% margin, India's median pay of $19,761 becomes about $25.52 an hour, and the US median of $155,000 becomes about $200.
 (opens the full-size chart in a new tab)
Each input is explained below, with the reason for its value. They are assumptions for the example. They aren't Arrowbin's numbers, and they aren't a survey of what vendors charge.
- On-costs, 30%: employer taxes, insurance, paid leave and benefits. These vary a lot by country. In the US, the BLS employer cost survey puts benefits at 30.0% of total private-industry compensation in June 2026: $14.07 on top of $32.82 in wages, or about 43% of wages.
- Overheads, 25%: laptops, software licences, office or co-working space, management, recruiting, sales and the time people spend between projects.
- Billable hours, 1,500: a full-time year is 2,080 paid hours (52 weeks of 40). Holidays, leave, internal meetings and training take the rest, so 1,500 is about 72% of paid hours.
- Margin, 20%: what the company keeps. Dividing by 0.8 is deliberate, because a 20% margin means 20% of the rate, which is more than adding 20% to cost.
United States
- Median yearly pay (USD)
- $155,000
- Illustrative hourly rate (USD)
- $200
United Kingdom
- Median yearly pay (USD)
- $95,299
- Illustrative hourly rate (USD)
- $123
Germany
- Median yearly pay (USD)
- $83,340
- Illustrative hourly rate (USD)
- $108
Poland
- Median yearly pay (USD)
- $55,040
- Illustrative hourly rate (USD)
- $71
Brazil
- Median yearly pay (USD)
- $32,767
- Illustrative hourly rate (USD)
- $42
Ukraine
- Median yearly pay (USD)
- $31,765
- Illustrative hourly rate (USD)
- $41
India, 10+ years
- Median yearly pay (USD)
- $40,684
- Illustrative hourly rate (USD)
- $53
India, all levels
- Median yearly pay (USD)
- $19,761
- Illustrative hourly rate (USD)
- $26
Pakistan
- Median yearly pay (USD)
- $9,937
- Illustrative hourly rate (USD)
- $13
With these inputs, the shortcut is yearly pay ÷ 774. Change any input and the shortcut moves. Using the US benefit load of about 43% instead of 30% lifts the US example to about $217 an hour, and if a team bills only 1,200 hours a year, every rate in the table rises by 25%.
Two cautions. A rate built on one median developer isn't a team rate, since real projects mix senior and junior people with a lead and QA. And a quoted rate far below what this formula gives for the experience you've been promised should prompt a question about who's actually doing the work.
How did we calculate these numbers?
We used the public results files of the Stack Overflow Developer Survey for 2025 and 2026, published by Stack Exchange Inc. Stack Overflow's 2026 methodology page says that survey ran from June 23 to August 5, 2026, with 30,903 valid responses from 169 countries. For 2025, the public file has 49,191 responses.
- Who's included: people who code as the main part of their job (2025: 'I am a developer by profession'; 2026: 'I create code as a primary part of my job') whose employment status is 'Employed'. Freelancers, the self-employed, students and the unemployed are out. Neither wave splits full-time from part-time employees.
- Pay: the survey's ConvertedCompYearly field, which is total yearly compensation converted to US dollars by Stack Overflow using exchange rates. Its methodology page doesn't name the rate source or date.
- Cleaning: we dropped converted values under $1,000 or over $1,000,000 a year as likely entry errors, such as monthly pay typed as yearly. That removed 599 of 26,015 answers, leaving 25,416.
- Thresholds: a country median appears only with at least 100 respondents across both waves. Experience bands need 50 in the band, and the per-wave medians in the CSV need 100 in that wave.
- Experience: years working professionally (the WorkExp question), grouped as 0–4, 5–9 and 10+.
- Rounding: medians and quartiles are rounded to the nearest dollar.
Limits matter as much as method, so here they are plainly:
- It's a self-selected sample that skews toward experienced developers who use Stack Overflow.
- Country means where the respondent lives, so a developer in Poland paid by a US company counts as Poland.
- Pooling two years mixes two sets of exchange rates, and some people may have answered both years.
- Stack Overflow applies extra exclusion flags to the charts it publishes. Those flags aren't in the public files, so our medians can differ from pay figures Stack Overflow reports.
- Stack Overflow corrects some Ukrainian answers that look like dollars typed under hryvnia. Ukraine's big move between waves suggests caution with that country.
What's in the CSV file?
The CSV has one row per country: region, respondents_n, median_usd, p25_usd and p75_usd, then per-wave counts and medians, experience-band counts and medians, and a note for countries below the threshold. A blank cell means too few respondents.
Our CSV is a derived database under the Open Database License 1.0, like the survey data it comes from. If you reuse it, credit 'Stack Overflow Developer Survey, Stack Exchange Inc.' and Arrowbin, and share any database you build from it under the same licence.
How to cite this data
Suggested citation: Arrowbin, 'Software Developer Salaries by Country in 2026 (Real Data)', October 15, 2026, arrowbin.com/blog/developer-salaries-by-country. Based on Stack Overflow Developer Survey 2025 and 2026 public data (Stack Exchange Inc., ODbL 1.0).
How should you use these numbers when comparing development quotes?
Use them to check that a quote fits where the team lives and how senior it is. Choosing a country by its median alone is a quick way to land the cheapest rate and the most expensive project.
Our custom software cost guide gives blended hourly rates by region as Arrowbin estimates. This data gives you a sourced view of the pay underneath those rates, so you can test our estimate instead of taking it on trust.
When you're down to a shortlist, ask each vendor for the experience mix of the people on your project and run their rates through the formula above. Our guide to choosing a software development company covers the other questions worth asking.
If you're budgeting a first version, the hours matter as much as the rate, and our MVP cost guide shows how to estimate both. For a second opinion on a quote, or to see how our custom software development team would scope your project, send us a short brief.
Key takeaways
- 01In the US the median employed developer earns $155,000 a year, against $19,761 in India and $9,937 in Pakistan, so the US median is 7.8 times India's and 15.6 times Pakistan's.
- 02Experience narrows the gap: with 10+ years, Indian developers earn about a quarter of the US median for the same band, against about a tenth for those with up to four years.
- 03Eastern Europe ($31,765 to $56,438) and Latin America ($32,767 to $41,347) overlap, so the team and time zone matter more than the region.
- 04Bangladesh, Vietnam, the Philippines, Indonesia, Nigeria, Egypt, Sri Lanka and Nepal had fewer than 100 qualifying respondents, so we publish no median for them.
- 05Survey medians run above official statistics: 16% above BLS in the US and 23% above ONS in the UK.
- 06With illustrative inputs, an hourly rate is roughly yearly pay divided by 774; the formula matters more than the shortcut.

Written by
Md. Shishir Ahmed
Founder, Arrowbin
Founder of Arrowbin. Writes about shipping software, what it costs, and the decisions that decide whether a product works.